Item (Exploratory Statistics: Hurricane analysis, part 2/3)
Item Card (XML) | Package Info| ID | f2451793dc3840fa8bbe40f01739044e |
| Item | part2_explore_hurricane_tracks.ipynb |
| Item Type | file |
| Owner | esri_notebook |
| Uploaded | Apr 25, 2019 |
| Modified | Apr 25, 2019 |
| Thumbnail |
|
| GUID | N/A |
| Name | N/A |
| Title | Exploratory Statistics: Hurricane analysis, part 2/3 |
| Type | Notebook |
| Type Keywords | Notebook, Python |
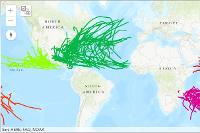
| Description | This notebook will demonstrates exploratory analysis on hurricane tracks. You will map hurricanes into basins, explore the number of hurricanes in each basin and sub basin. You find which hurricane names are most popular. Through overlay analysis, you will find the what percent of hurricanes make landfall, the distance they travel inland after landfall. You will explore the landfall locations further, do a density analysis and through geo-enrichment, you will understand the demographics of the population that lives in these high risk places. |
| Tags | Density Analysis, Climate Science, Climate, GeoAnalytics, Aggregation |
| Snippet | Perform exploratory data analysis on hurricane tracks. |
| Extent | N/A |
| Spatial Reference | N/A |
| Access Information | N/A |
| License Information | N/A |
| Culture | english (united states) |
| Properties | {"notebookRuntimeName":"ArcGIS Notebook Python 3 Standard","notebookRuntimeVersion":"10.7.1"} |
| Url | N/A |
| Proxy Filter | N/A |
| Last Modified | N/A |
| Size | 2782181 |
| Documentation | N/A |
| App Categories | N/A |
| Industries | N/A |
| Languages | N/A |
| Listed | false |
| Comments Enabled | true |
| # Comments | 0 |
| # Ratings | 0 |
| Avg. Rating | 0.0 |
| # Views | 285 |
| Categories | Data Science and Analysis |
| Content Status |
Child Resources: Comments Rating Groups Item Data Item Data as Zip Item Dependencies
Supported Operations: Add Comment Add Rating Delete Rating Related Items Share Item Unshare Item Package Item Set Item Content Status